How to migrate from Chartio to Veezoo
Chartio is joining Atlassian and shutting down the product by March 1, 2022. You might be using Chartio for a long time now. Perhaps it is your main BI solution. So you must be wondering what to do next, how will you migrate all your dashboards to a new tool?

We want to help you make a quick and smooth transition.
We want to make sure that you can continue using all the dashboards that you already created, and that you can make analytics even more accessible with Veezoo’s conversational interface to data.
So we have developed this step-by-step guide to support you with the migration to Veezoo.
If you have any questions or need any support, you can contact us or schedule a call. We will be very glad to help you! 🙂
Before we get started, here is some information about Veezoo:
Veezoo is an innovative BI solution based on a conversational interface to data. We enable anyone to visualize the information that they need from their data by, literally, just asking for it. It works on top of a semantic layer, abstracting your entire database, so that you don’t need to create new views every time you are building a dashboard. Also, it works directly on top of your data warehouse, so that you don’t need to duplicate your data and create new data silos.
So, let’s get started:
5 Steps to Migrate from Chartio to Veezoo
1. Prioritize the charts that you want to migrate.
With thousands of charts to migrate, it can take a few hours or days to migrate everything to Veezoo. So it’s important that you use the Usage Stats from Chartio to start with the most viewed charts.
Let’s start with a first dashboard on sales performance and take the chart: “Monthly Sales”.
2. Connect your Database to Veezoo
Create an account at Veezoo for free and connect your database. Here are the data connectors that we currently support:
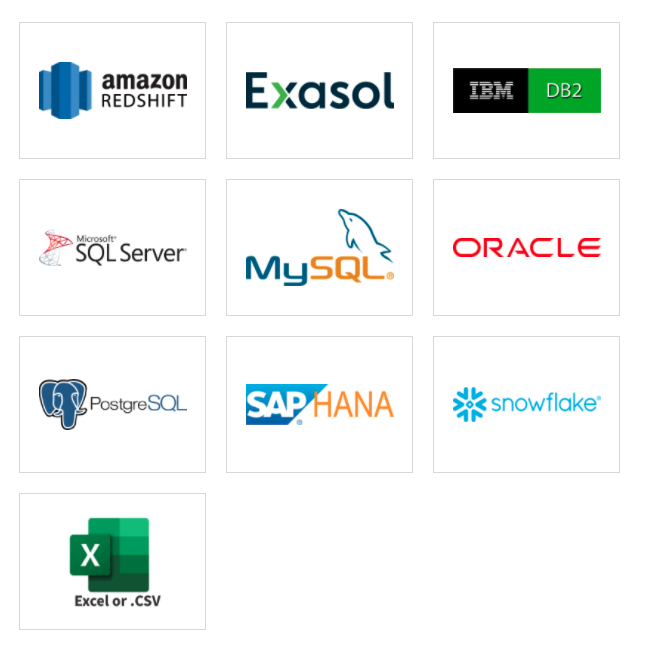
Choose your database and select the tables and columns that you want to import. Veezoo will automatically build a semantic model of your data, identifying how the tables relate to each other and mapping the meaning of the concepts with a Knowledge Graph.
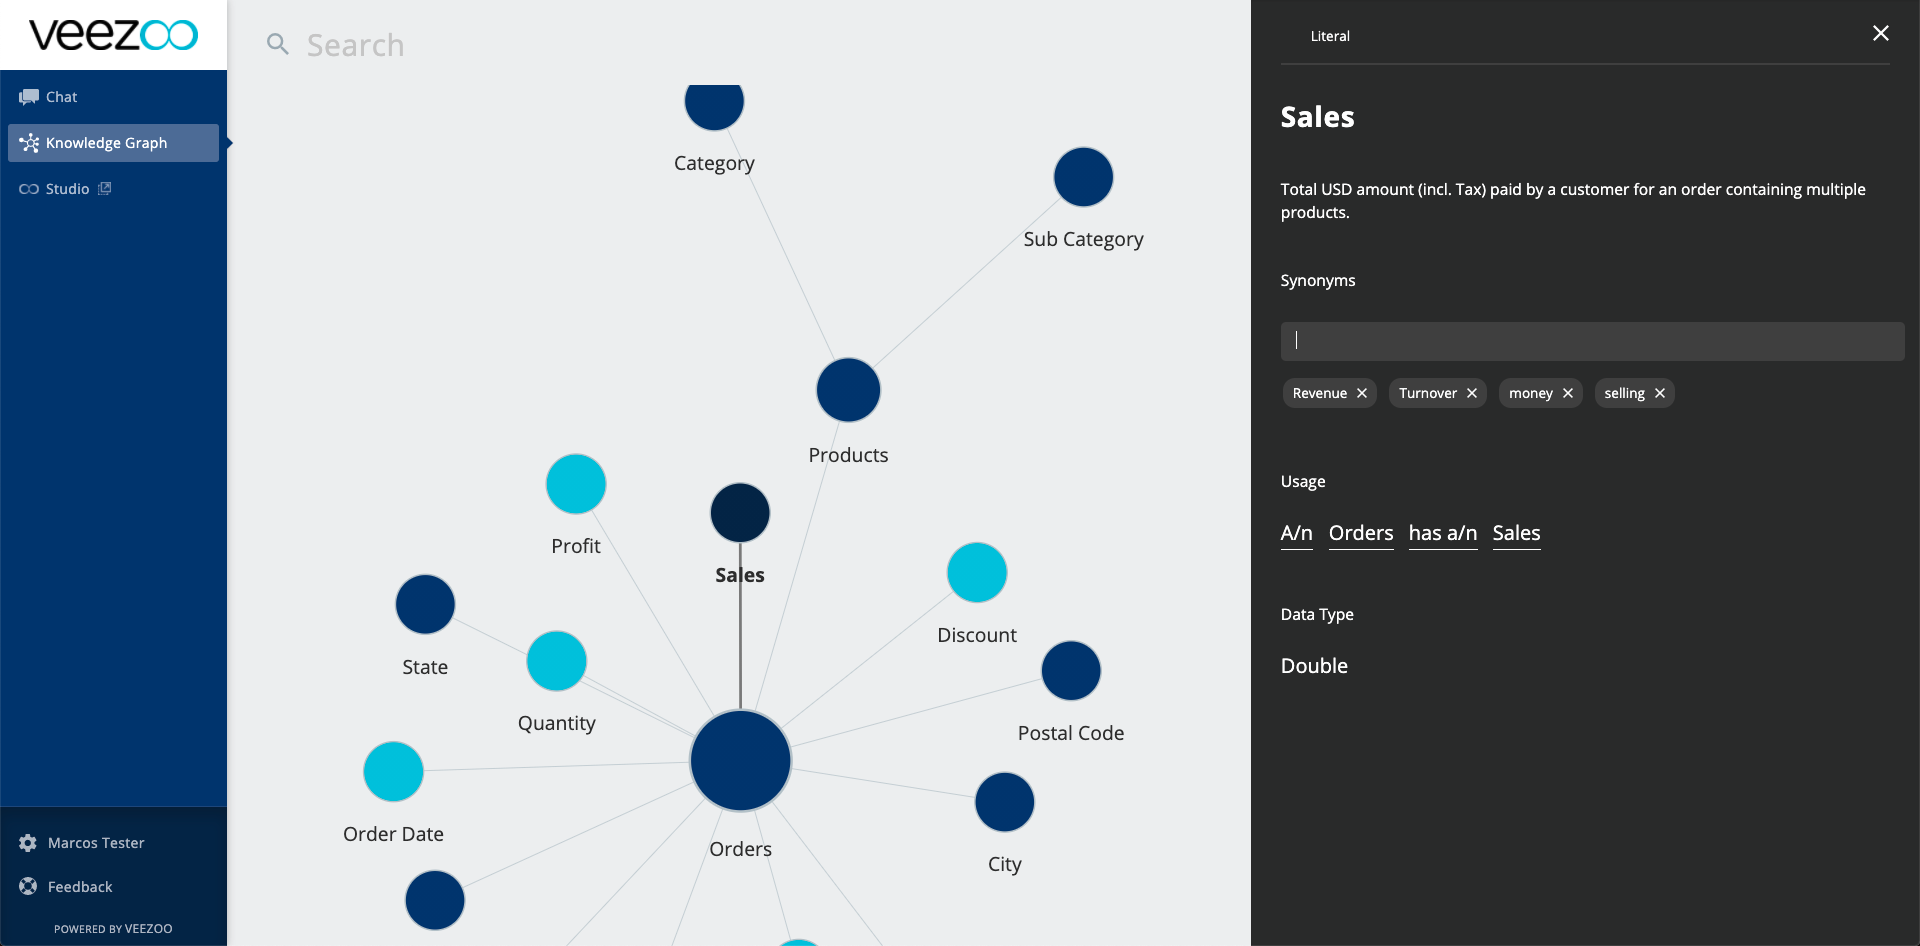
3. Define Synonyms for Columns with Cryptic Names
If your database has columns with names that are not clearly understandable, it might also be difficult for Veezoo to map the concepts. In this case, open your Knowledge Graph to see how the tables were linked and define synonyms for those columns.
For more advanced configuration, check our documentation.
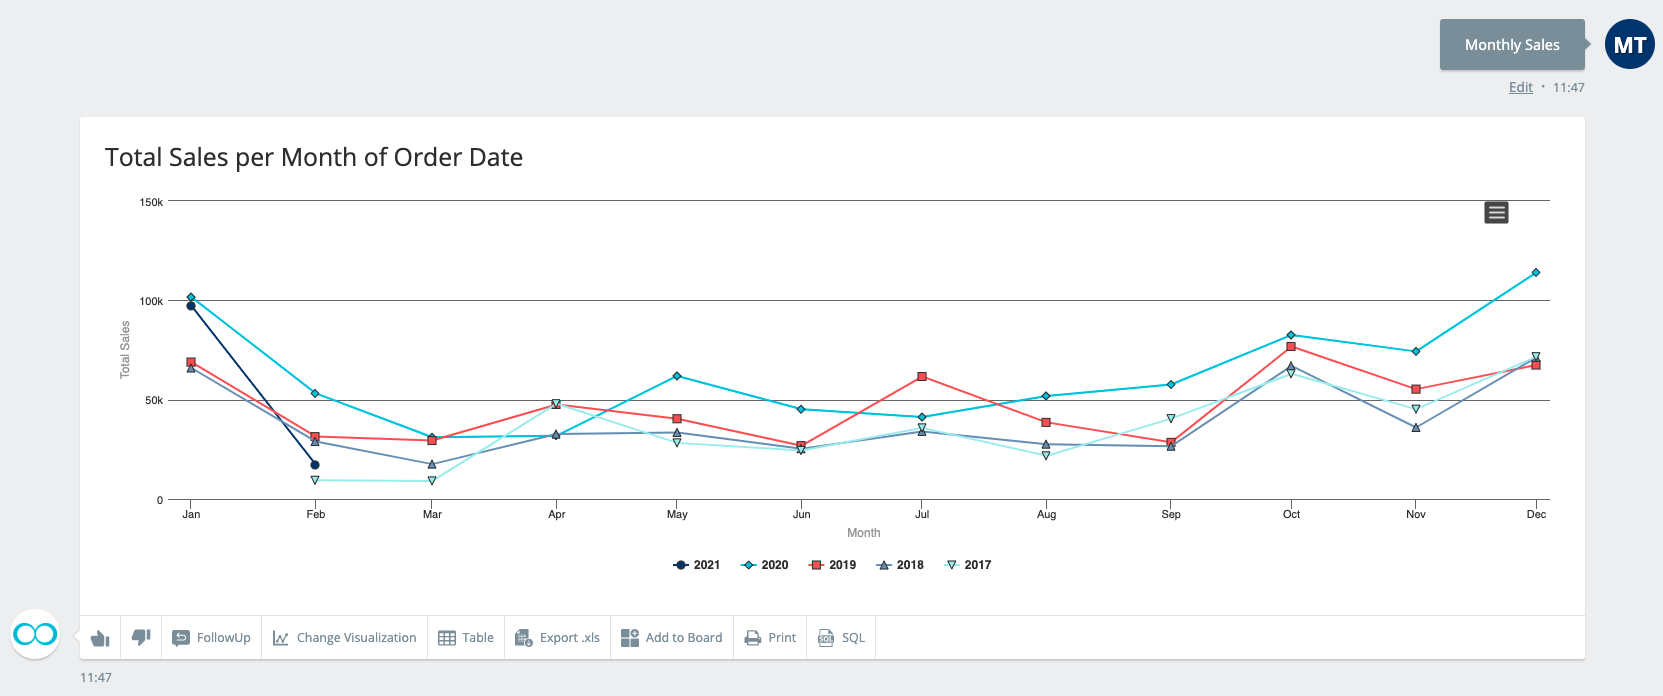
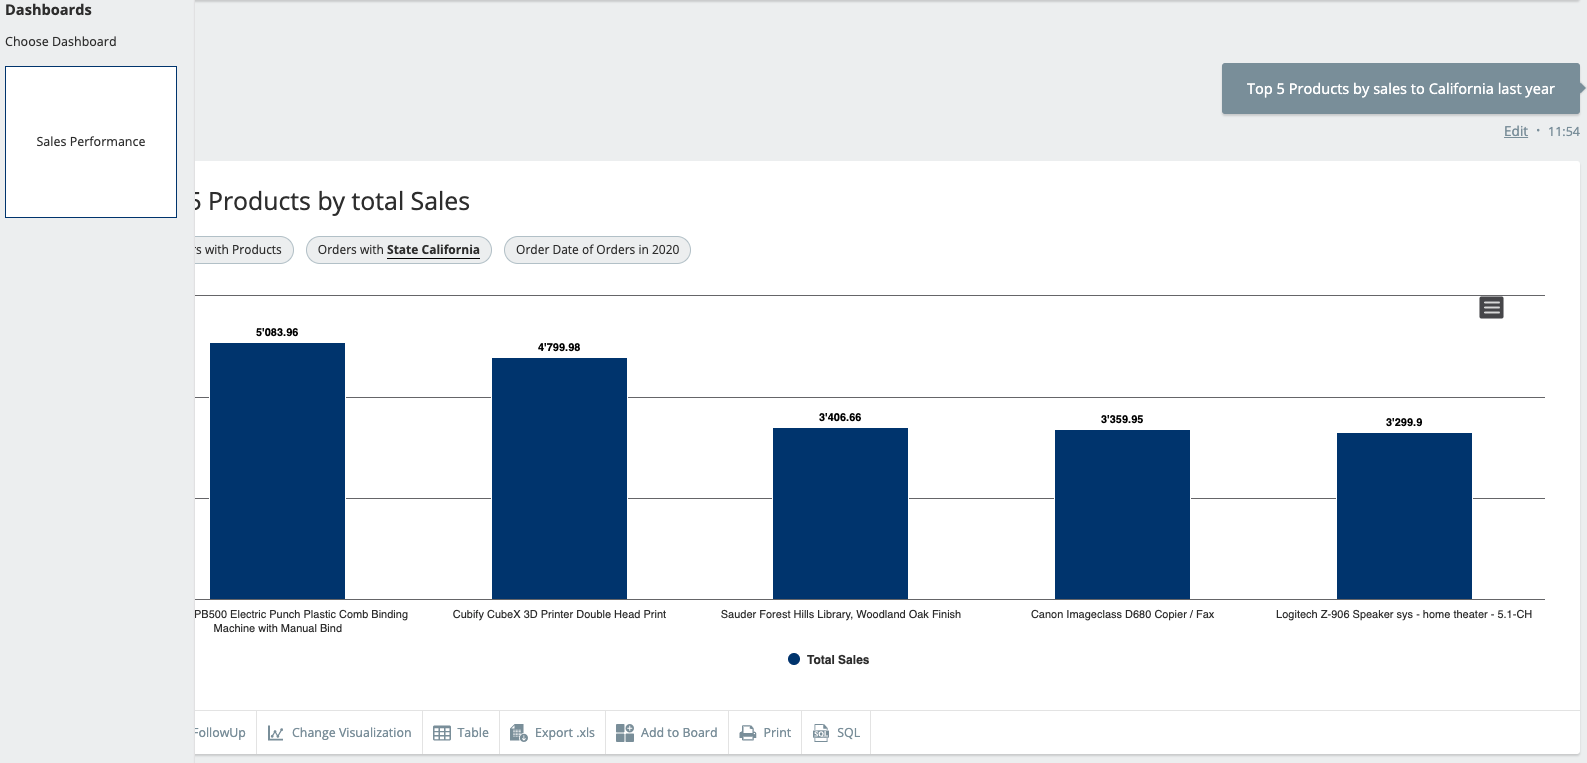
4. To create your chart, simply ask for it.
Now that everything is set up, you can create your first chart. Simply ask Veezoo for what you want to visualize. That’s it!

Veezoo will translate your question into a SQL query and quickly create the right visualization for you.
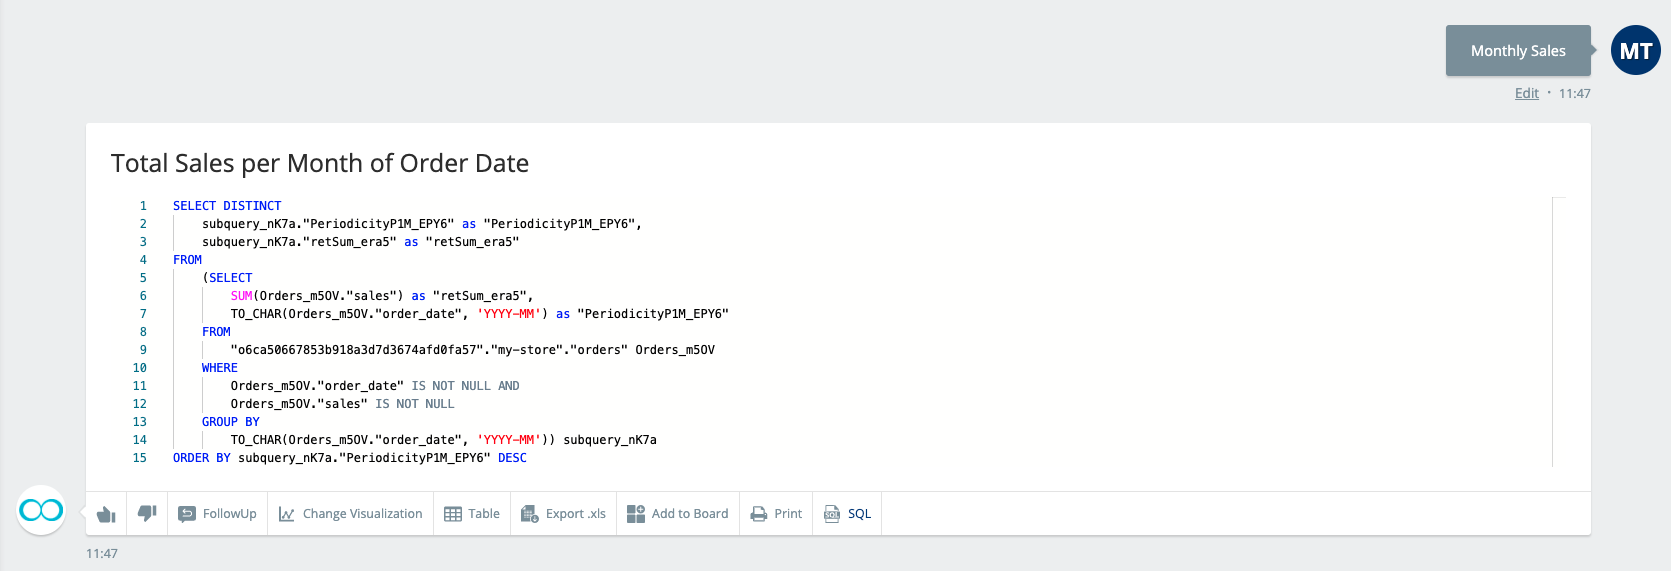
You can then check the SQL and compare with the one from Chartio to make sure that it is correct.
5. Repeat the last step for every chart in your dashboard.
For every chart in your dashboard, simply ask Veezoo to build it for you. Then add them all into a new dashboard. It should take you not more than 5 minutes to rebuild an entire dashboard. Within a day, one person might be able to recreate up to 100 dashboards in Veezoo.
That’s it!
Veezoo is simple to use and fast to get started. If you need any support our team is ready to help you at any time. Contact us here!