Salesforce analytics – the fun way!
A short guide on how to make Salesforce analytics easy, fast and fun!
If you have used Salesforce reporting functionality and wondered if there is an easier way to do it, don’t worry! You are certainly not alone in this. Many people struggle getting the reports that they need and wonder the same. We will show you now how you can use Veezoo to get insights from Salesforce in an easy, fast and also very fun way!
Our mission here at Veezoo is to make access to information extremely easy. Our approach: simply type a question and our system immediately delivers the answer with an insightful visualisation. However, it’s only when you try for the first time that it becomes especially clear how valuable this way of working really is.
After hearing about so many people who struggle with Salesforce reporting – and end up not using it -, we decided to present more in detail how Veezoo provides a great alternative for getting insights from Salesforce.
Salesforce: 6 steps to create 1 report
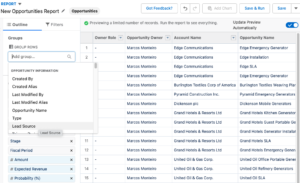
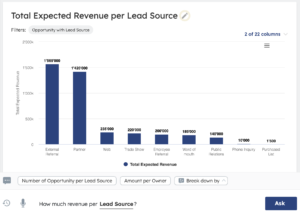
The most common reason why people struggle with Salesforce reporting is that they get lost with the amount of options to click through. In one very simple example, it took me around 6 steps in Salesforce to get the visualisation I was looking for.
I had to choose one of different report types, look for the required filters and group bys, and make sure that only the correct ones are set. It took me a while to find out how to choose the metrics that I wanted to visualise. I had to select a type of aggregation and it would implicitly assume that this was the metric to be visualised, so I finally managed to create a chart.
All of this leaves room for errors, especially when users struggle to understand the technicalities of the available data and report functions. It’s not by chance that Salesforce needs to offer a lot of documentation and guidance to help with creating reports. The most common way out is to have dedicated Salesforce developers and admins who are responsible for generating and maintaining the never ending list of reports and report requests. But this option is not scalable nor cost effective and creates a bottleneck for every new employee who comes onboard.
Real self-service needs to speak your language
We believe that the end user should not require documentation nor technical training to be able to find the answers to his or her questions. The machine needs to understand the end user’s language, not the other way around. People need to be able to immediately get an answer whenever they have a question.
That’s what real self-service really means. It creates a deep sense of empowerment and independence. It takes away the hassle of the irrelevant technicalities of generating a report in the traditional way. Asking for insights suddenly becomes extremely user friendly, fun and fast.
Setting up Veezoo with Salesforce
Sync Data with Fivetran
We will now walk you through the main steps for the technical setup of Veezoo with your Salesforce data. We want to show you how this part can also be very easy to go through, if you are using the right tools for the job.
As you can’t query Salesforce directly with SQL, the first step to use Veezoo is to bring your Salesforce data into your own database.
The easiest way to do this is with the right extraction tool such as Fivetran or Airbyte. We chose Fivetran and its out of the box native connector to Salesforce. They have a 14-day free trial. Give it a try, if you want to follow the steps here.
Once you connect Fivetran to your database, all you have to do is to enter your Salesforce credentials and choose the tables you want to import. It will then automatically sync your Salesforce data with your database.
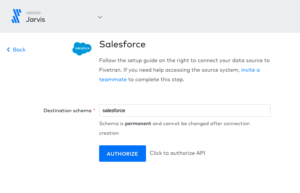
That’s it! You are ready to connect Veezoo.
Connecting Veezoo
Getting started with Veezoo is even easier. Create your account and connect to the database containing the salesforce data which you just imported.
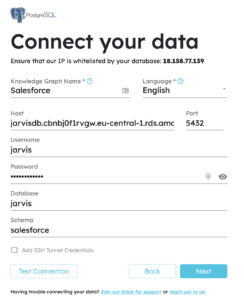
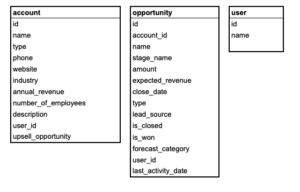
Then choose which tables and columns you want to start with. We suggest that you start with a small set and later add more data as required. For this demo we selected the following tables and columns:
Now you can start asking your questions!
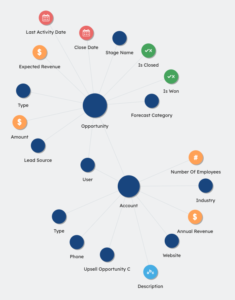
Veezoo has automatically created a semantic representation of your data, the Veezoo Knowledge Graph, which is used to understand and answer your questions.
You have full control over the Knowledge Graph and you can configure Veezoo to answer the questions the way you want, implementing new business logics and defining specific display preferences. You can learn more about it by reading our technical documentation.
Now it’s your turn
If you are looking for an easy way to explore your data, run reports and get new insights, sign up for Veezoo and get started now. Did you know Veezoo is free for up to 5 users? We look forward to welcoming you as part of our community.