[Original Research] – Why it’s Complicated: Our Relationship with Data in 2022
In this whitepaper, we explore the challenges and opportunities facing data practitioners today, based on a survey of 400+ professionals from across Europe and the US.

Data has become an increasingly important part of business decision-making, but many organizations struggle to make effective use of the data they have. In this report, we explore the challenges and opportunities facing data practitioners today, based on a survey of 400+ professionals from across Europe and the US.
Have you ever felt overwhelmed by the amount of data you have to work with, but struggled to find the insights you need? This is a common problem faced by many data practitioners, as they strive to use data to inform and improve their decision-making processes.
According to a recent study by Forrester, only half of the business analysts surveyed said that they put data at the center of their decision-making. Yet, 84% of these analysts agreed that having data at the center of decision-making is critical for their organization’s success.
To better understand why some data practitioners find it difficult to use data effectively, we partnered with Pollfish to survey a diverse group of data practitioners from 11 countries. Our respondents were from companies with 500+ employees, and 81% of them said that they use data at least once a week or more frequently.
In this whitepaper, we present the main findings of our survey and explore the challenges and opportunities facing data practitioners today. We also discuss the potential benefits of self-service analytics tools, which can help non-technical users extract insights from data without requiring specialised knowledge or support from a data team.
The Audience has Spoken – Our Main Findings
We asked our audience a series of questions aimed at understanding how they use data on a day-to-day basis, how comfortable they are with various aspects of crunching numbers and the challenges they face in order to become data driven. Here’s what we learnt:
- Nearly half our participants were not comfortable with all aspects of data analysis although 71% of respondents received a minimum of 5 hrs of training on the BI platform used by their organization.
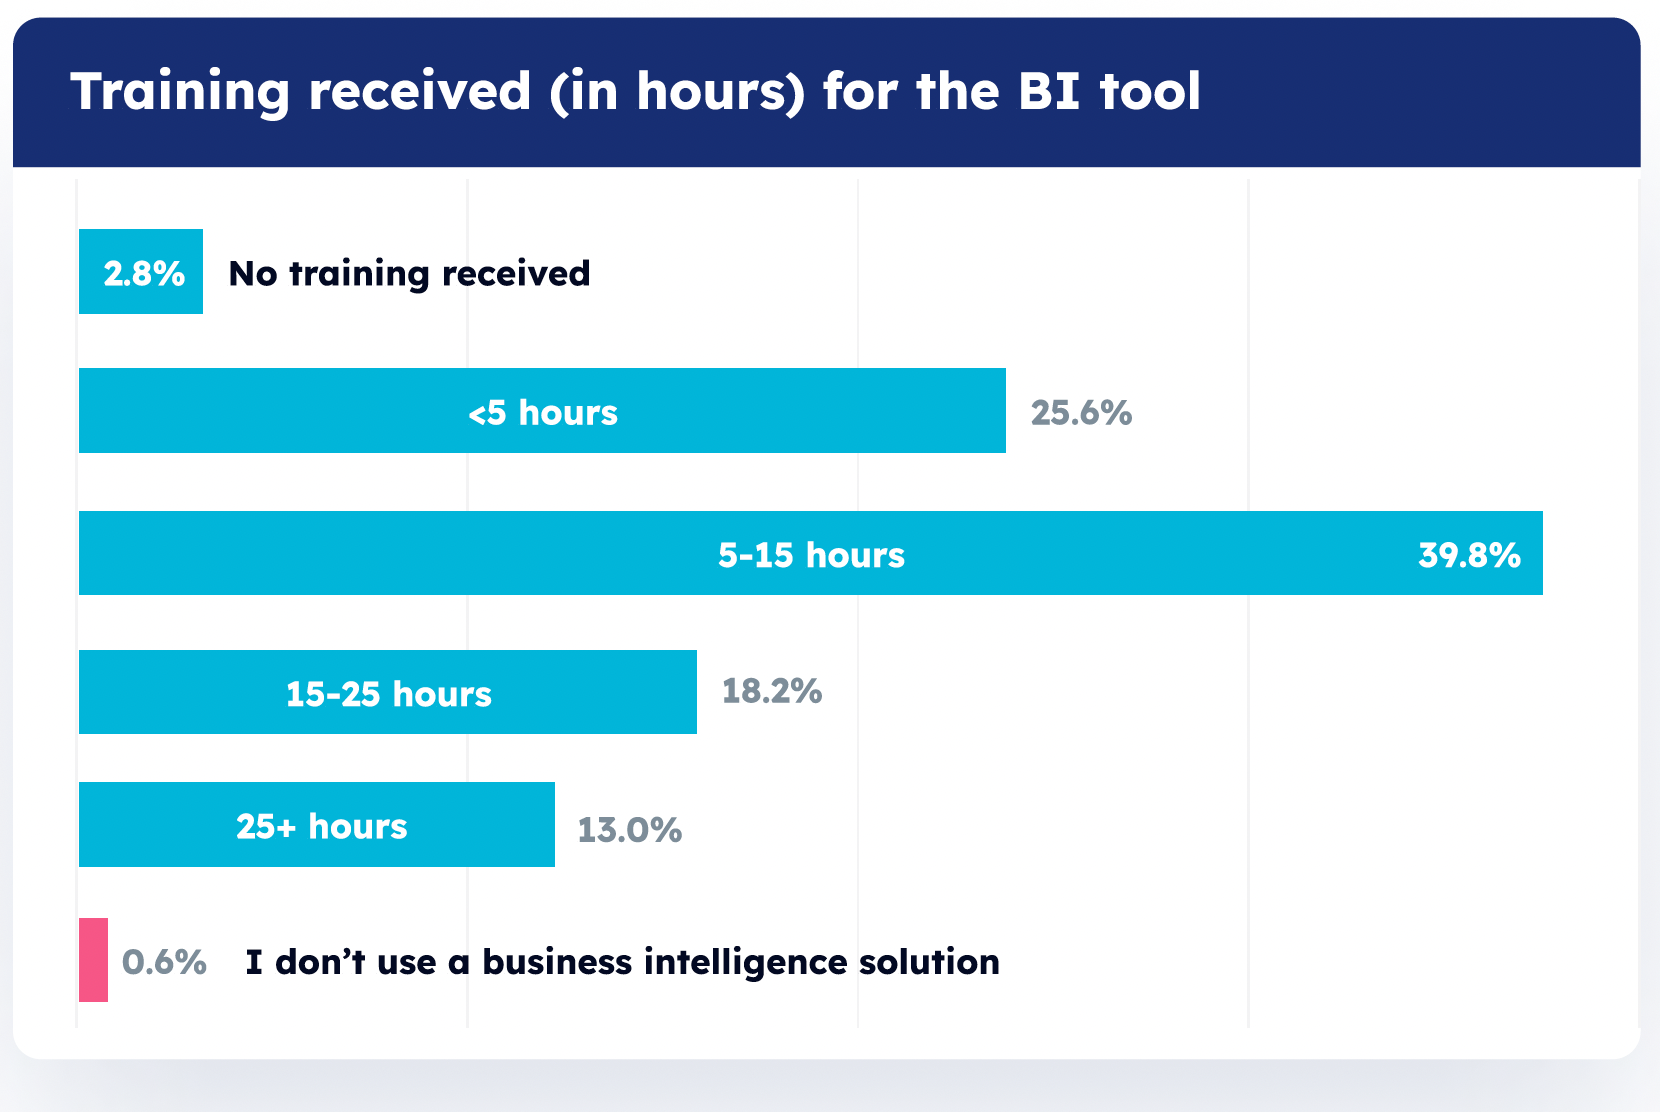
Hours of training received for BI tool
- Roughly a quarter of participants said that a lack of data-literacy was the reason that their organizations were not data driven.
- When asked what they would like to see in a new BI tool, an overwhelming majority of respondents said that they preferred a search-like tool where they could simply ask a question and receive the answer.

Top requested feature in a new BI tool
Data is King, but Being Data-driven Isn’t Easy
What we did see unanimous agreement on is that today’s workforce loves data and makes data driven decisions. This could be because the usefulness of data has been proven time and again.
However, they are limited in their ability to work well with data because this usually requires a certain level of technical expertise or knowledge of a language like SQL, depending on the tool being used. Or they are limited by the size of the data team.
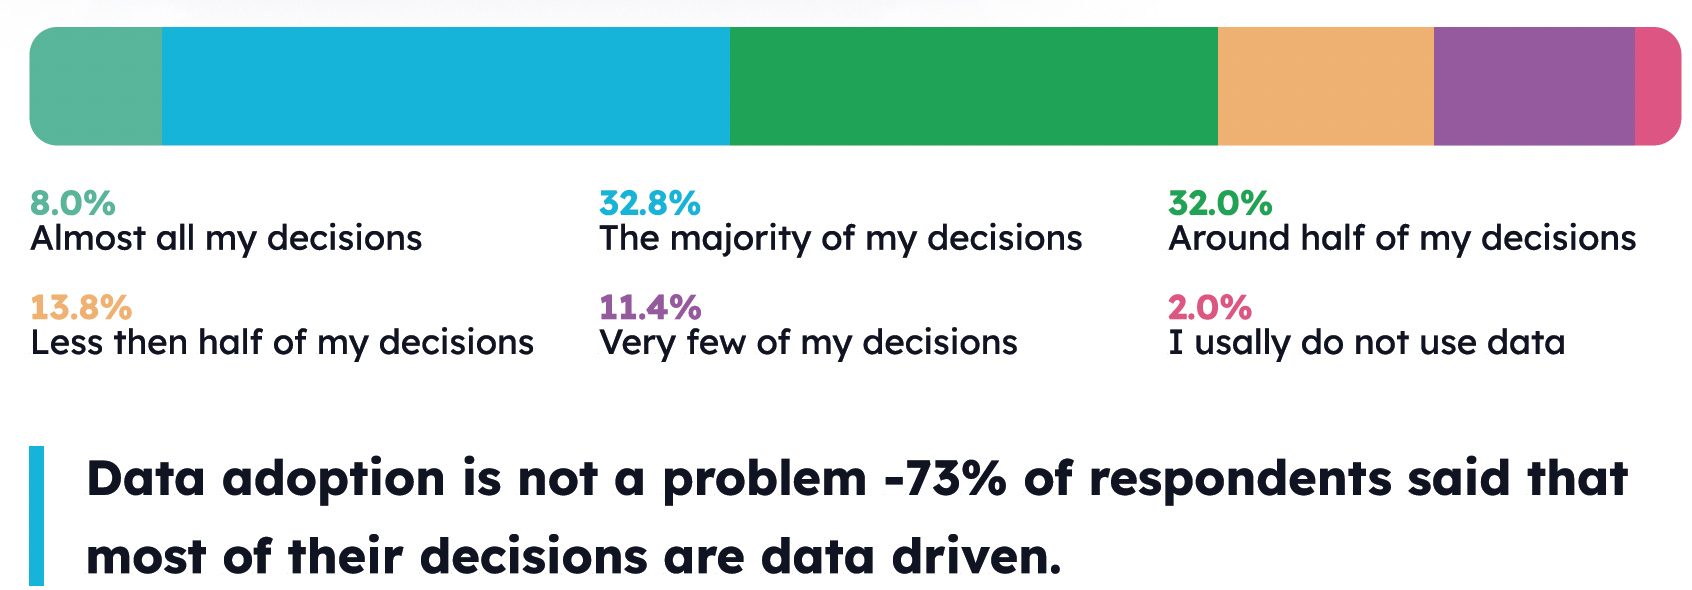
Percentage of data-driven decisions
In view of the fact that 73% of our respondents said that most of their decisions are data driven, but are limited in their ability to extract insights from data that will actually power those decisions, this points to a very obvious bottleneck scenario. This means that decisions are taken but people are often “stuck”.
Bottlenecks = Sunk Costs, So What’s the Solution?
The bottlenecks mentioned above cause back and forth between various teams, time lost and delays. In short, it’s not efficient and costs companies. But for the moment, the data bottleneck seems to pose a pretty big hurdle. But there is indeed a way out. As per our respondents this can either involve additional headcount or getting a tool that is easy-to-use for business users.
Enter Self Service- Analytics
That’s where self service comes in – non tech/business users can leverage a tool like this to find the insights that they need to make the best decisions for their day to day jobs, without waiting on a data team to deliver insights and information. This helps increase productivity and efficiency and most importantly can play a part in preventing bottlenecks.
Our respondents overwhelmingly wanted a search-like self-service analytics tool where they can ask their questions and simply receive answers – over factors such as speed, integration etc. This makes sense because in our personal lives, more often than not, when we don’t know the answer to something, we just use a search engine to come up with it. This seems “natural”, because this habit is deeply ingrained within us.
On the other hand, finding answers in our professional lives is not so intuitive – therefore there is a marked desire for a tool that brings the intuitiveness of using a search engine to find answers into our professional lives.
This also means that respondents showed a definite preference for being self-sufficient, reducing dependencies and potential bottlenecks.
It could therefore pay off for companies to create an environment where employees are enabled to be independent, yet armed with the right tools to make the right calls for their job function.
Wrapping up
Our study examines how data is used in the workplace today and the hurdles associated with maximizing the full potential of data – from the point of view of those who use data in their day to day jobs. Respondents have shown a marked preference for a simpler tool that is more intuitive. Download the full study to learn more.
")