Chartio Alternatives for Data Analytics & Business Intelligence
You are probably looking at this article with Charito alternatives because they just got acquired by Atlassian. A sunset date of March 1, 2022 still gives you some time to find the perfect alternative for your needs. And we are here to help you, even if our tool doesn’t end up to be the best alternative for you.
What features does Chartio offer
First of all we need to have a look at the features Chartio offers to get a feeling for what we need in an alternative. In short, Chartio’s mission is to make data accessible to anyone.
Let’s list a couple of features they used to make this possible.
- Easily create custom charts
- Easily create custom dashboards
- Visual SQL
- Speed up the process of getting valuable insights out of your data
- Connect all your datasets and blend data together
How we will compare Chartio to alternatives
To make a good, easy to understand comparison between all of these Chartio alternatives we will evaluate each one of them on the following areas:
- Custom charts
- Custom dashboards
- Easy to use interface
- Cloud platform
- Easily connect your data sources
- No coding required
Shortlist of Chartio alternatives
- GoodData
- Grow.com
- Veezoo
- Cumul.io
- Looker
- Tableau
Chartio alternatives
GoodData
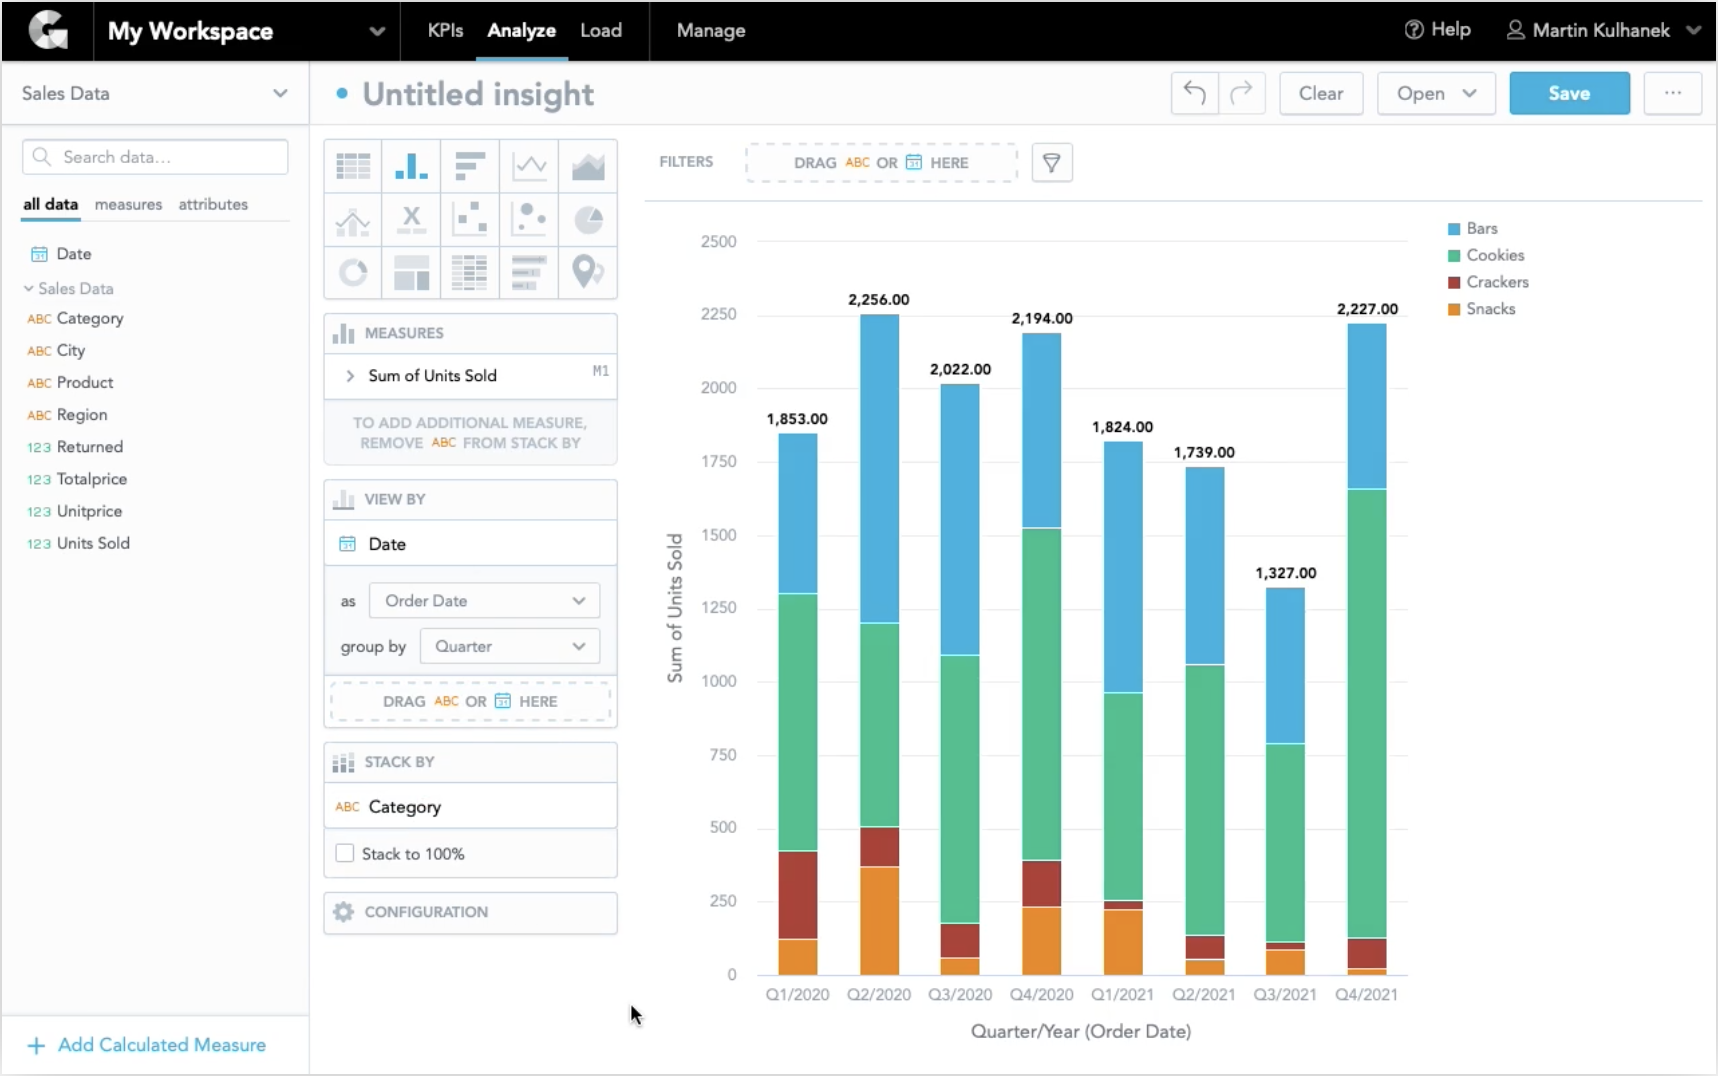
Image source: gooddata.com
GoodData is a tool to easily create analytics dashboards for business intelligence. It used its own query language (MAQL) to do this.
Pros
- Accessible pricing model based on workspaces, not users
- Can be used by someone without prior knowledge of SQL for the basic metrics
- Offers a GUI for data preparation
Cons
- Limited options to connect your data
- Uses its own query language (MAQL)
- There is a bit of a learning curve to get started
Grow.com
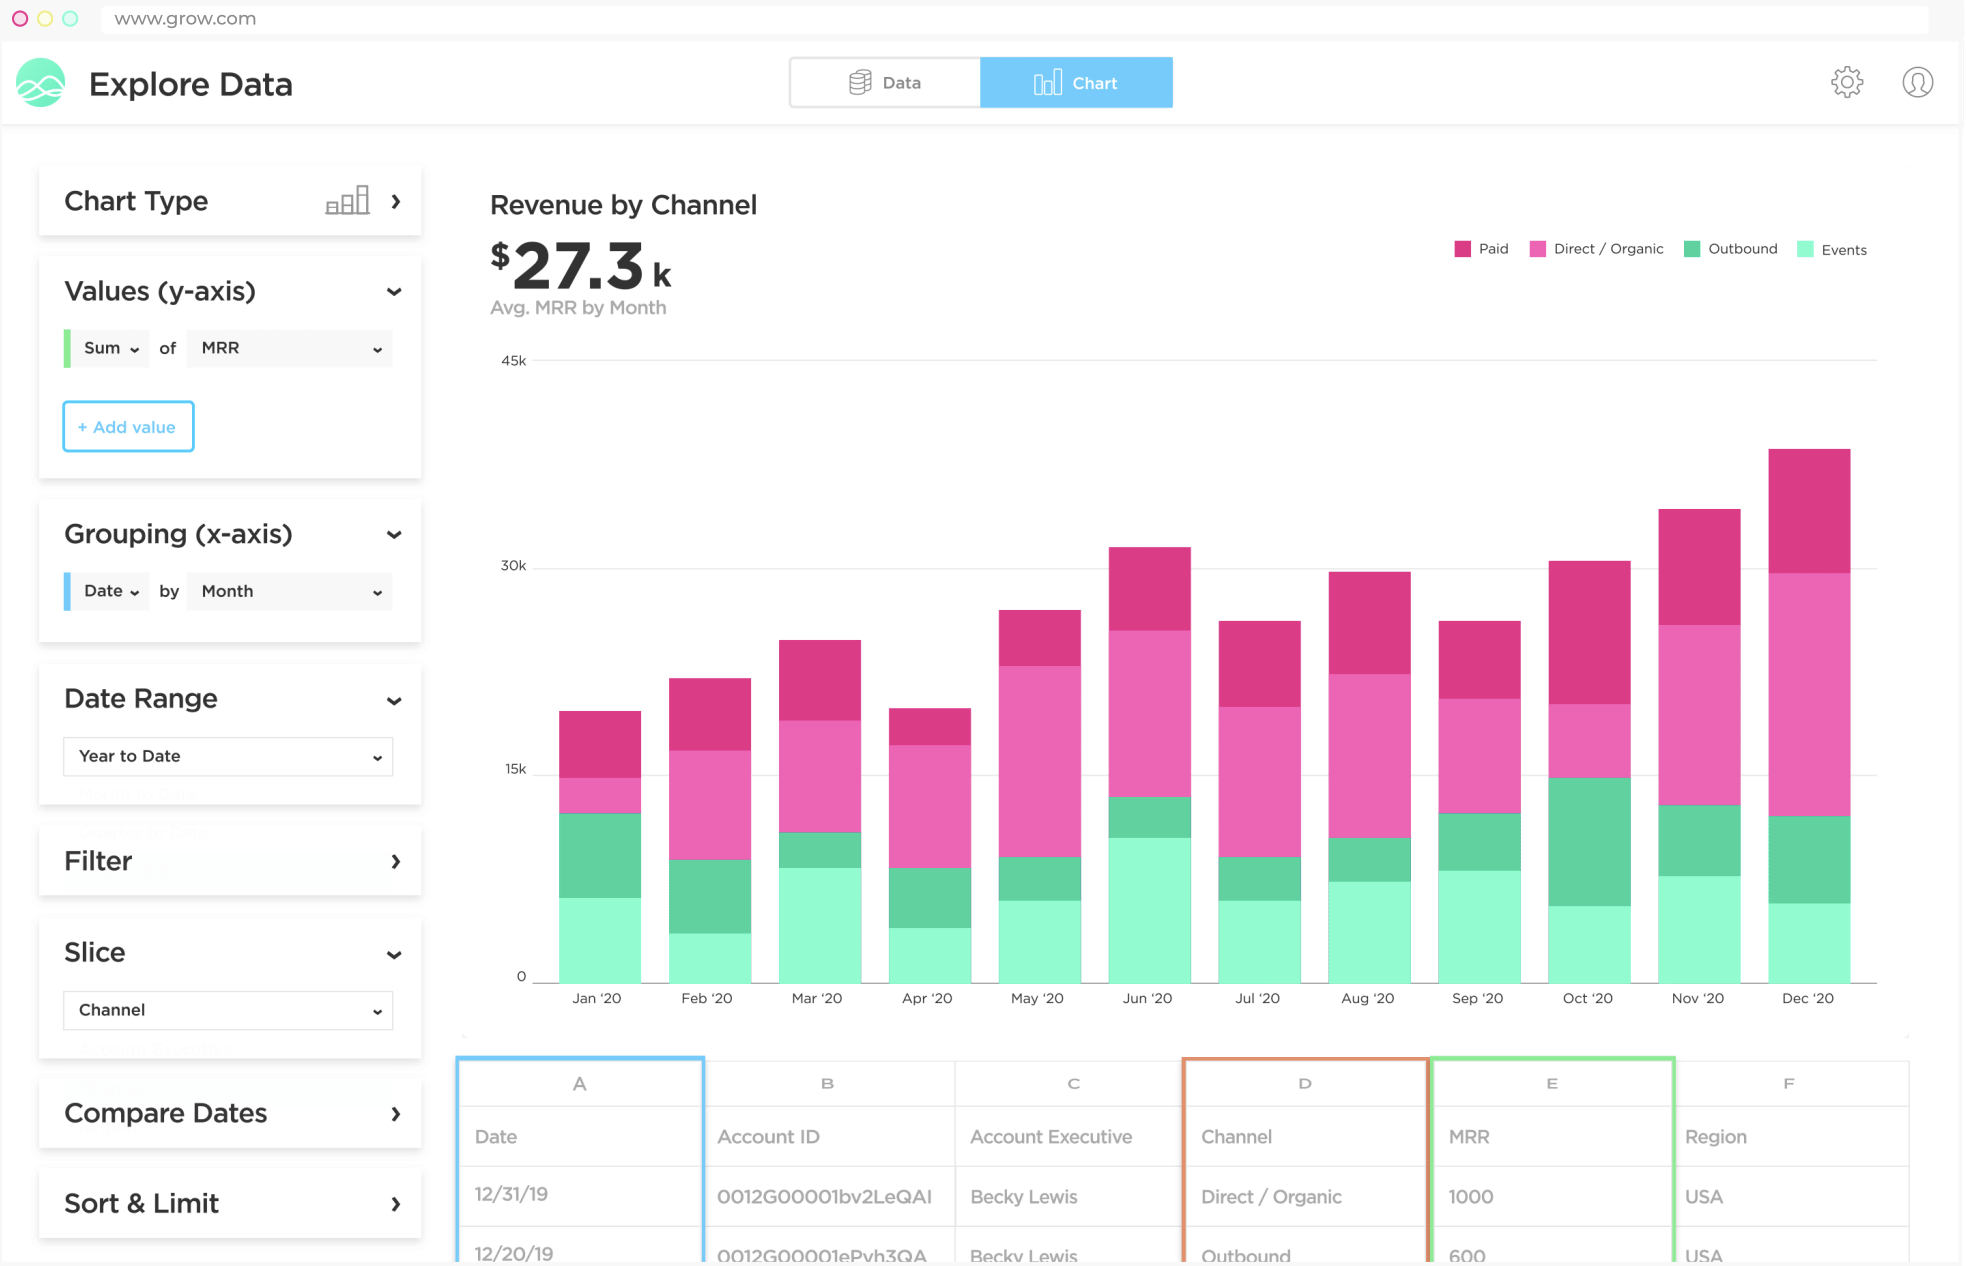
Image source: grow.com
Grow.com offers full-stack business intelligence software for growing companies. They are making BI accessible through dashboards so anyone can get the answers unique to their business.
Pros
- Build dashboards using a GUI
- Team of developers who will help you while you are building your dashboards
Cons
- Knowledge of SQL needed
- Can sometimes lack some customization abilities
- More difficult to use for non-data people
- No public pricing available
Veezoo
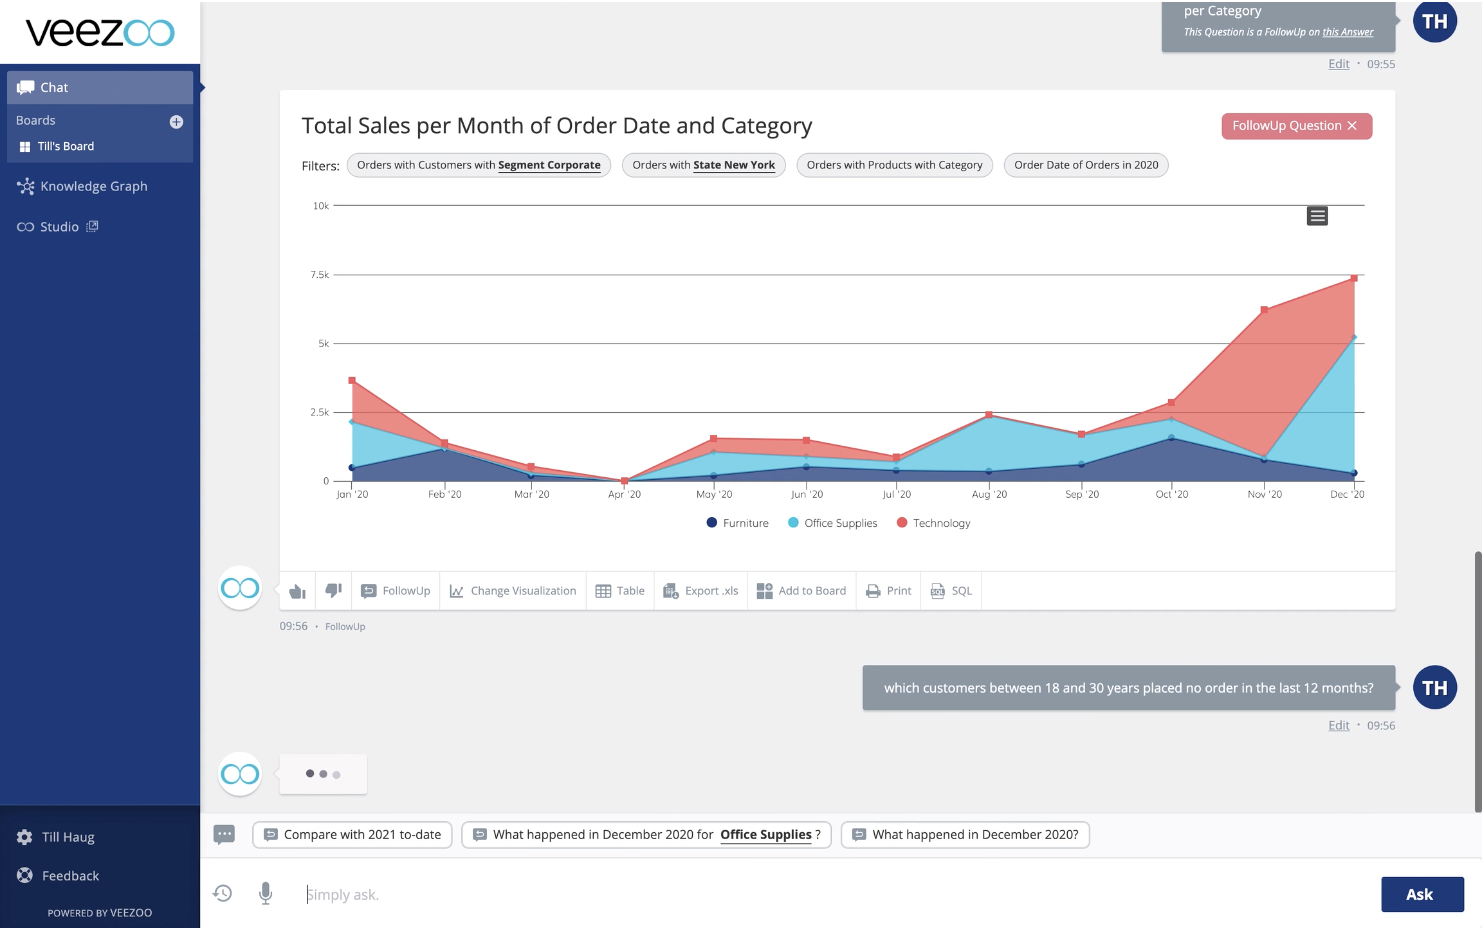
Veezoo is a data analytics tool that makes it possible to find the answers for your business questions just by asking them. It uses natural language analytics to make this possible. Once you have the graph you need you can easily add it to a dashboard for future reference.
This makes it very easy for any employee to just “play” with your data to find the insights they need and build their own dashboards.
Pros
- Easy to use for any employee without any previous data science knowledge
- Create custom dashboards right from your natural language analytics searches
- Straightforward pricing model available on the website
- Very easy migration from Chartio that can be executed by anyone
Cons
- You might need to use an alternative chart for some chart types in Chartio
- Someone with data knowledge might be needed for the initial setup of the tool, but support can help you with that
- Only works with one database per project
Cumul.io
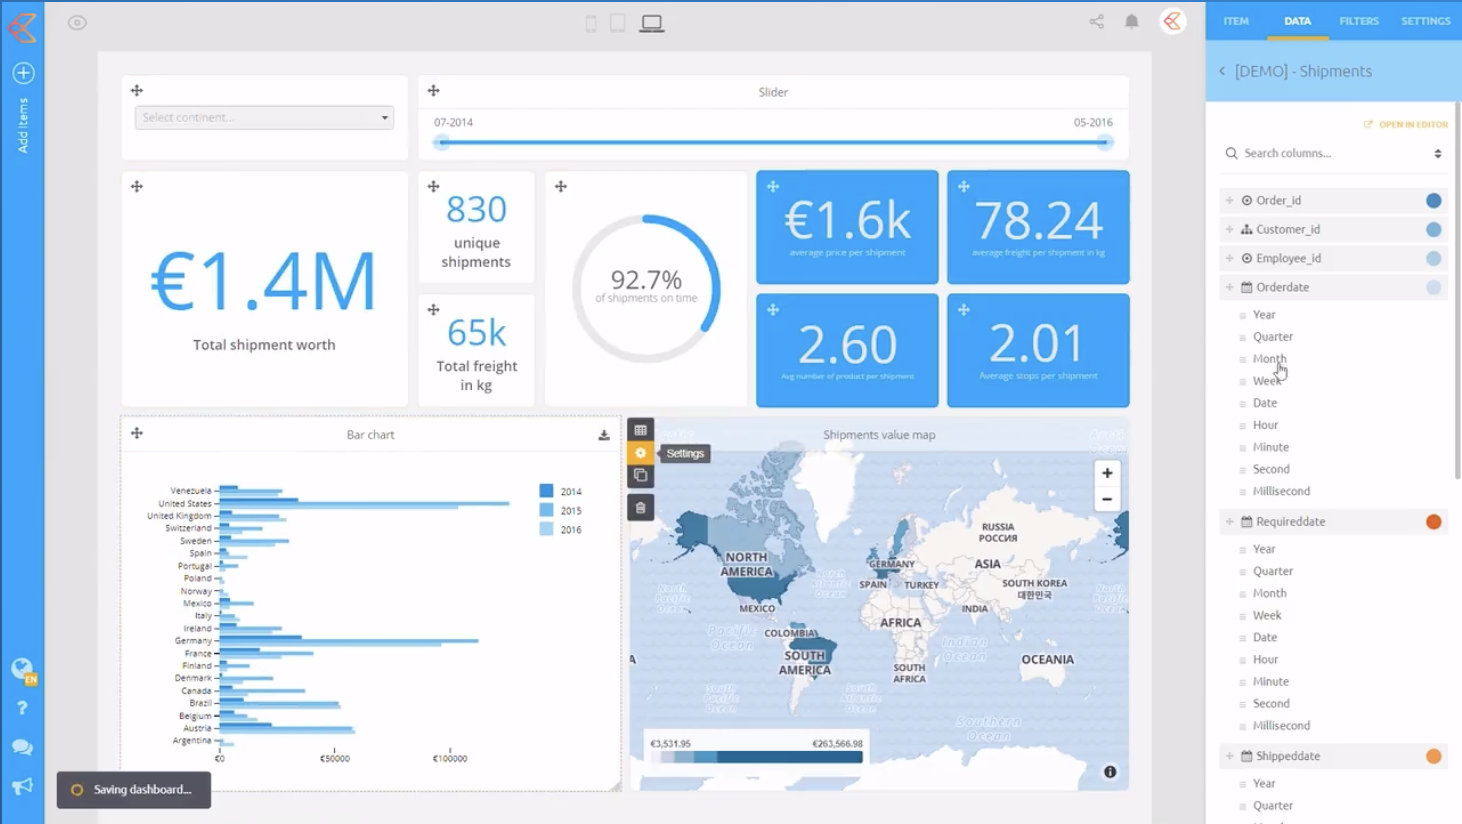
Image source: cumul.io
Cumul.io calls itself “the building block for dashboards in your platform”. With some data knowledge already there, you can create beautiful dashboards within minutes.
Pros
- Very flexible tool to build beautiful dashboards
- API access available for customer integrations
Cons
- Starting at € 830 a month it has steep pricing compared to Chartio
- Although there is a GUI available to create formulas, some prior data knowledge is needed
Looker
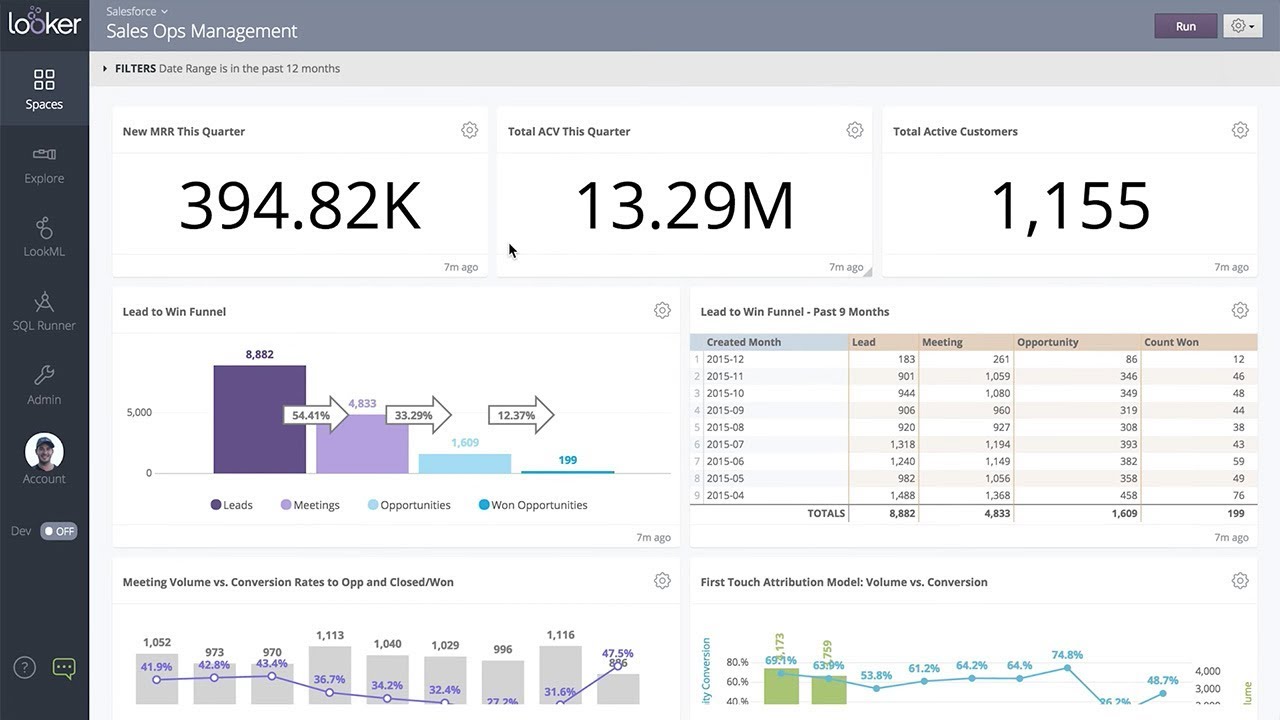
Image source: looker.com
Looker is part of Google Cloud’s data analytics platform. Looker uses its own data modeling language called LookML in which data analysts write code to define the business metrics and manipulate data.
Pros
- Offers Git integration for collaboration
- Very supportive pre-sale team
Cons
- Steep learning curve
- No public pricing available, but communities learn us it’s quite expensive
- Requires a strong data team to manage LookML and do all setups for the business team
- Only works with one database per project
Tableau
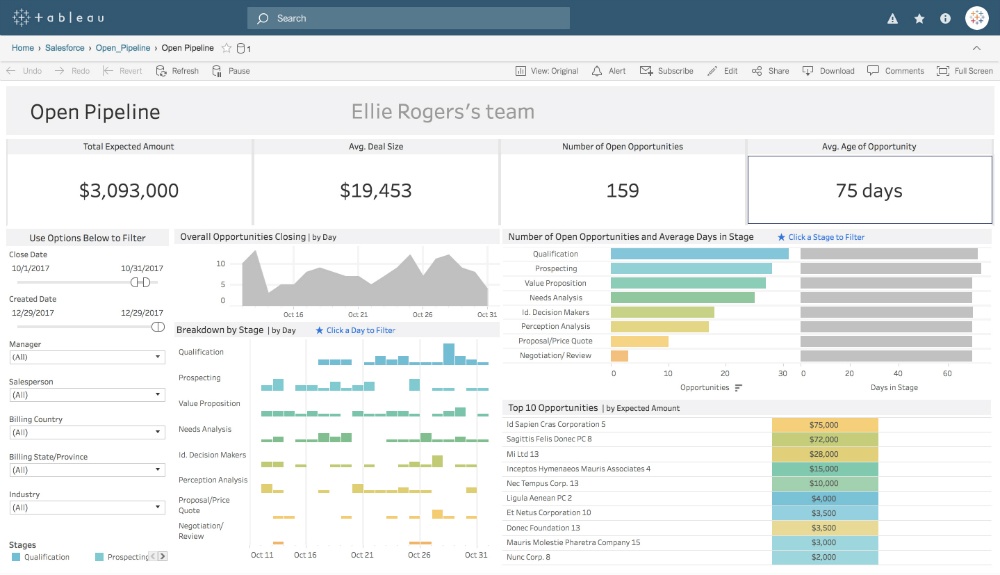
Image source: tableau.com
Tableau is a visual analytics platform that offers a wide range of services to connect, prep and visualize data. It offers both cloud and on-premise solutions. The overall structure to work with Tableau seems a bit more extensive than Chartio.
Pros
- A wide range of tools to work with and visualize your data
- A large amount of native data connectors available
Cons
- The learning curve can be a bit steep
- Not 100% cloud based
- More expensive than Chartio
What’s the perfect alternative for you
Chartio alternative for business intelligence
If you are looking for a data analytics tool that is intuitive enough so all employees can use it, then we would like to encourage you to give Veezoo a try. Veezoo really democratizes data within a company so anyone can find the insights they need to do their job, without the need for someone from the analytics team to find their answers.
Sounds interesting? We would love to give you a quick demo of how Veezoo can unleash the through potential of data analytics for everyone within your company. Reach out to us and let’s make it happen.
Ready to migrate? Read our article to see how easy it is to migrate from Chartio to Veezoo. You’ll be up and running in no time.
Chartio alternative for embedded dashboards
If you were using Chartio mainly to create embedded dashboards, then cumul.io will probably be your best bet. Although it is a lot more expensive than Chartio, it will provide you with all the resources you need for embedded data dashboards that Chartio has to offer and even more.